The top command is a popular tool among Linux users for monitoring system performance in real-time. However, there are several alternatives to top that provide additional features and functionality.

I’m using docker to illustrate some of the available tools as I’m lazy to spin up a VM, so bear with me 🤪
Here are a few examples:
htop
This command is similar to top, but it provides a more user-friendly interface with color coding and scrolling capabilities. It also allows users to sort processes by a variety of criteria, such as CPU usage or memory usage.

atop
This command provides a more detailed view of system performance than top. It includes information about system resources such as CPU, memory, and disk usage, as well as network and process-related statistics. It also allows for the collection of historical data for later analysis.

glogg
This command is a graphical version of top that provides a more intuitive interface for monitoring system performance. It includes real-time process monitoring and it allows users to filter processes based on various criteria.
⚠️ Note that glogg is a graphical application that needs a display environment (aka desktop)
iotop
This command is specifically designed for monitoring disk I/O usage. It provides real-time information about the processes that are performing the most I/O operations, and it allows users to sort processes based on I/O usage.
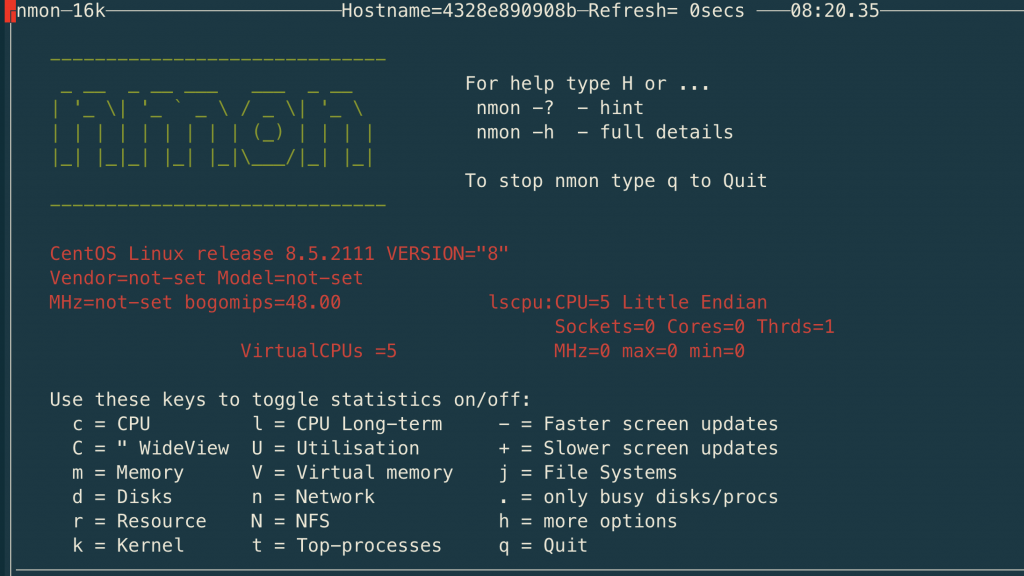
nmon
This command is a powerful tool for monitoring system performance. It provides information about CPU, memory, disk, and network usage, as well as detailed process information. It also allows for the collection of historical data for later analysis.

dstat
This command is a versatile tool for monitoring system performance. It provides information about multiple system resources (e.g. CPU, Memory, Disk, Network, etc) and also it allows for the collection of historical data for later analysis. It also provides a clean, easy-to-read output that makes it useful for scripting.


No Comments
Leave a comment Cancel